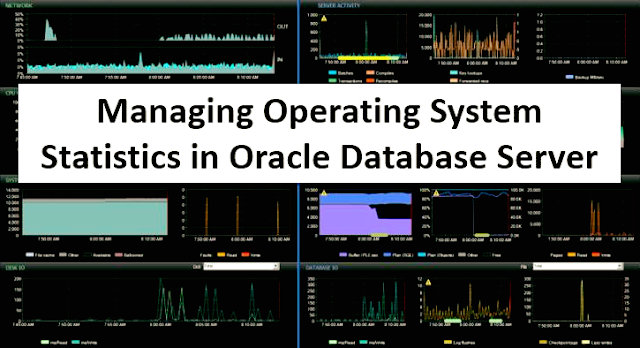
Operating system performance issues commonly involve process management, memory management, scheduling and storage management.
Many times we get into the performance issue if we don't follow the common Oracle best practice like system parameters, improper swap allocation, hard/soft limit, not configuring hugepages wherever it requires.
If you have tuned the Oracle database instance and still need to improve performance, tune the OS, network and storage part.
Well, here we have given some of the basic statistics management which can help to boost the performance in your environment.
- Doesn't exceed 95% in total
- Check DB share on CPU
Virtual Memory Statistics:
- Validate that memory usage does not increase after the system has reached a steady state after startup
Disk I/O Statistics:
- Current response time should be between 5 to 20 ms for a single block IO the length of the disk queues shouldn't exceed two
Network Statistics:
- Look at the network round-trip ping time and the number of collisions
- Investigate it, if the network is causing large delays in response time
Reducing Disk Contention:
- Increase the number of disks in the storage system
- Separate the database and the redo log files
- For a large table, use partitions to reduce I/O
- Stripe the data either manually or by using a RAID disk-striping system
- Invest in cutting-edge technology, such as file caching, to avoid I/O bottlenecks
- Consider using ASM

